Introduction
What is COVID-19?
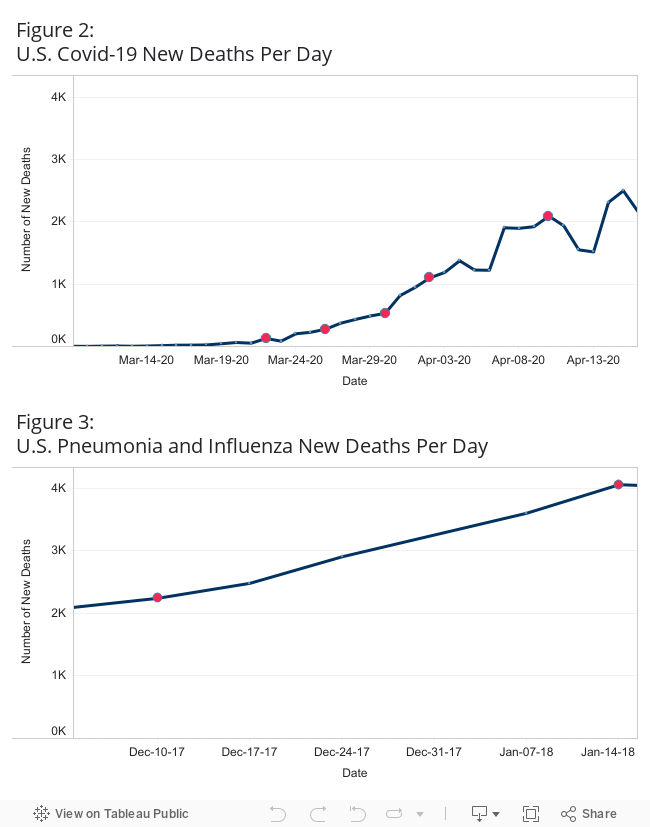
What is the big deal?
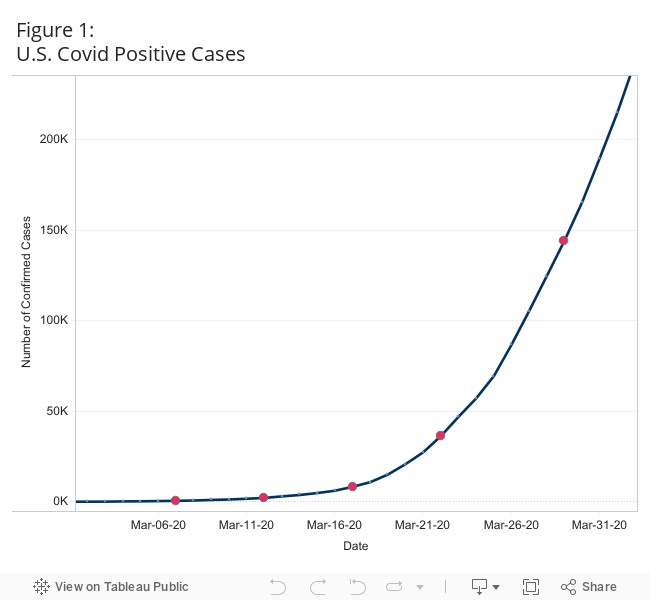
Understanding Exponential Growth
What is COVID-19?
What is the big deal?
Understanding Exponential Growth
Three default highlighted countries below show you examples of early, average, and late adapters.
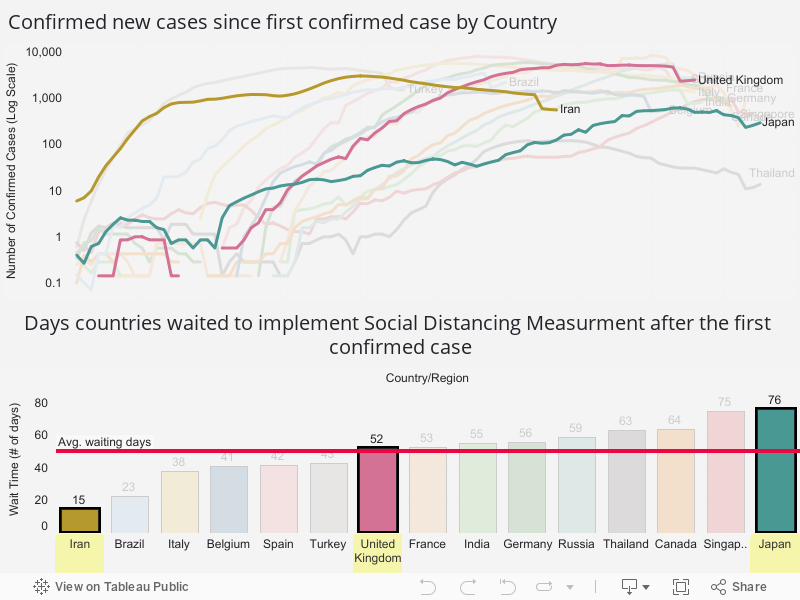
Disclaimer: Data as of April 13th, 2020. China and the U.S. are excluded in this chart because of regional and state independent decisions on social distancing measurement implementations.
Timely implementation matter?
Social distancing, also called “physical distancing,” means keeping space between yourself and other people outside of your home (CDC, 2020). Left chart includes new confirmed cases in 15 heavily infected countries and the average days before their national government issued a shelter-in-place order (average about 50 days).
CLICK on a specific country to compare its trends before/after the implementaion date. Use CTRL + Mouse click to highlight multiple countries or hover them to learn more details on the readings.
Delayed Effect
Newly confirmed cases in most countries only began to flatten 2-3 weeks after social distancing measurements are implemented. For instance, in the case of Spain, it took 15 days before new cases reached its growth peak and started to stabilize.
Reactive or Preactive
Countries such as Iran, Brazil or Italy with earlier social distancing policies response (below average waited time) have a faster-growing and steeper exponential curve than late countries such as Japan or Singapore. This may indicate that social distancing policies are more of a reactive than a proactive preventative decision.
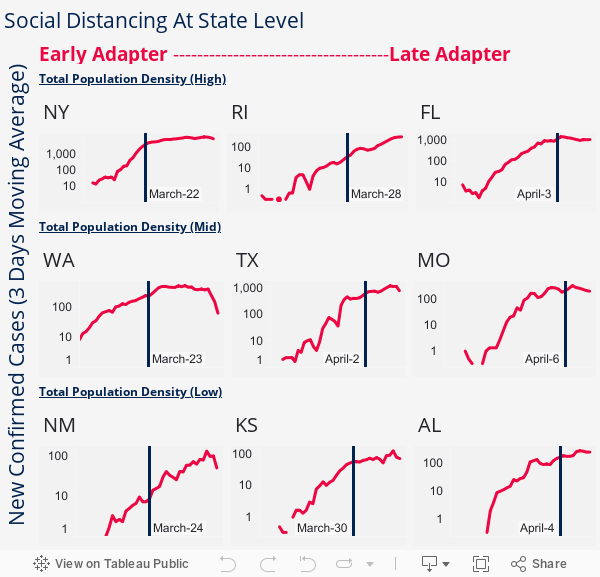
State Decisions
The chart on the right reflects different state implementations of social distancing policies in terms of early, average, and late adapters. The vertical lines are social distancing implementation dates implemented at the state level. Additionally, the charts are also arranged by state population density.
Different social distancing policies in the U.S. are not dramatically apart with the earliest in late March and latest about two weeks after. With given data, the effect of these measurements begins to show for the early adapters but may take longer for the late. It seems exponential growths in most states have been bent after social distancing policies are put into place.
Although some of the effect may be less prevalent in less populated states such as New Mexico, where new cases continue to grow. The most positive development seems to be in Washington State with newly confirmed cases clearly dropping compared to prior levels.
The Ripple Effect
Now we had some understanding of exponential growth of a disease and possible social distancing effect on the spread. Let’s try to visualize this effect. We created a simulitis on the left with a few adjustable sliders and a small section of interactive features to help demonstrate the possible effects on the speed of the spread. Let’s first try to drag the ball into the canvas without intervention and witness how the number of infected growth resembles exponential growth trend.
Utilize some adjustable features to slow down the spread and flatten the growth curve in a new simulitis. Parameters you can adjust include: 1. Probability of infection: Probability a healthy ball will turn into infected after contact 2. Percentage of Balls will stay still 3. Speed of the balls. Additionally, the interactive rectangle can be used to constrain movements of balls within one area. Infection probability and stop ball probabilities are in percentage while speed of ball is arbitrary. Now let’s compare the growth curve vs. last time
Make it flat
The chart below reflects the number of infected balls growth trajectory. The grey line represents growth trend of last simulitis or a hypothetical exponential growth line we obtained during experiment while the colored line represents the real time growth of the current simulitis. If your goal is to slow down the spread and to control the number of infected under 20, how can you achieve this? Try it out.
The time unit on the x-axis is currently in 2 seconds interval. When we tried to run the simulitis without interventions, we often observe a quick surge in infected cases (Double or triple) of cases in a short time period while interventions more than often would result in a straightened or flattened line. That extra 2 seconds, 2 hours or 2 days may be exactly what our first responders or medical professionals need to save our loved ones around us.
We realize this simulitis is an oversimplified representation of the complexity in real life. A ball bouncing across the screen may not reflect anything close to how we behave in our society. However, we wish the simulitis can be a way to demonstrate a single person’s decisions and actions can have much greater ripple effects in our society during this special time.
Covid-19 has brought unprecedented challenges for individuals, families, and countries across the world. The exponential growth of this novel coronavirus has left people and policy makers with uncertainty about how long this pandemic will last and how many more lives will be impacted. Without available vaccines and effective treatments, orders on social distancing are enacted by different countries’ national and local governments to lower interpersonal contact rate. For many of the heavily affected countries, social distancing has achieved a pronounced effect in containing the viral spread, usually within 2 weeks after implementation. Although it doesn’t come without costs, policy makers and each individual should consider practicing social distancing in a timely manner for the safety of the country, the vulnerable ones nearby or yourself.